Gravity Dynamics and Gravity Noise on the Earth Surface
Appendix B
Measured Results, Reproducibility and Space Dependency
Libor Neumann
Prague
January 2005
Content
Identified measuring device features and limits
Measured results reproducibility and disinteresting
Identified measured results summary
Reproducibility and Space Dependency
Reproducibility of short-term time dependency
Two weights in the same altitude
All weights in the same altitude
The weights in different altitudes
Reproducibility and Space Dependency Conclusions
Introduction
The appendix is divided into two parts:
- More detailed overview of measured results with related conclusions – Measured Results part
- Special part focused on measurement reproducibility and some aspects of space dependency of measurement results with its own conclusions - Reproducibility and Space Dependency part.
The overview uses results and conclusions from reproducibility and space dependency part.
Conclusion of measured results part was used for the main text conclusions.
The measured results part contains more detailed description of measured results with more illustrative figures than main paper text. The text structure is very similar to main text.
It was not possible to affect measured quantity (gravity interaction) by controlled human activity. Classic experimental methodology could not be used; reproducibility could not be tested directly by experiment repeating.
Measured results contain great portion of irregular components. The irregular component can not be simply separated from measuring errors and the separation would not be credible. Repeated measurements can not be used for direct separation of measurement errors.
Reproducibility of the measurement was validated by using of more measurement sets located in different localities in different periods of time. The time dependency and space dependency of measured quantity can not be separated from each other and from measurement irreproducibility.
This is the reason, why reproducibility and space dependency are discussed together in this appendix.
Reproducibility was validated by using of three very similar measurement sets. The sets differ only in some construction details like connected computer speed or microcamera objective type (with similar optical parameters).
All three sets were running simultaneously.
First used strategy was: two measuring devices were running permanently in the same localities (L1 and L2). Third set was moved in sequence to other different localities. This strategy enables us to compare results from different time periods in one locality and results from different localities in one time period with minimal applied sources (minimal number of measurement sets).
Second strategy was: one measuring device was permanently in one locality (L2) and two other measurement devices were moved together to close localities.
Experiments in near localities used special modifications of one measuring device.
About 160 various measurements of various duration (from several days to several weeks) were performed by the three measurement sets. It is more than 14 million elementary measurements (snapped and evaluated samples).
All measurement sets worked with acceptable technology reliability. Only a few different technological problems (most frequently power supply interruptions) caused measurement interruptions. The measurement devices were affected several times by insect and distant large earthquakes in short time intervals.
Measured results
Measured results are described in this section. Medium detail level is used in this appendix part. More additional measured results can be found in Reproducibility and Space Dependency part of the appendix.
Waveform
Measured displacements time sequence shows time dependent quantity.
Irregular component presence and seemingly random periodic displacements with 24 hour period superposition are the basic characteristic features of measured displacements.
Maximal amplitudes of measured periodic component were greater than 3x10⁻⁵ of standard gravity acceleration (i.e. about 300 mms-2, thus about 30 mGal or 3x10⁻⁵ Radian, thus about 6” – angle seconds). Examples of measured displacements time dependency from different seasons are displayed in figure 2 and 3.
Figure 1 – Time dependence of measured displacements in L2 locality – August 2000. L2-NS is measured displacements component in north-south direction in L2 locality. L2-EW is measured displacements component in east-west direction in L2 locality.
Figure 2 – Time dependence of measured displacements in L2 locality – December 2000.
Measured waveform is time dependent. Similar but not equal waveforms can be found repeatable in the same season of different years.
Short time variance of measured displacements is time dependent. The maximum to minimum variance ratio is greater than 5:1. Comparable variance values can exist for several days or several tens of days and variance value change can be quick or slow.
The figure 4 shows 3min variance of measured displacements in time interval with quick variance changes. The time interval was selected to illustrate time dependency of short time variance.
Figure 3 – Time dependence of measured displacements 3min. variance in L2 locality – August 2000.
Medium time variance of measured displacements has different time dependency and different values. Figure 5 and 6 show time dependency of measurement displacements 30 min. variance in two different seasons.
Figure 4 – Time dependence of measured displacements 30min. variance in L2 locality – August 2000.
Figure 5 – Time dependence of measured displacements 30min. variance in L2 locality – December 2000.
Medium time variance value of measured displacements can change in ratio greater than 1:3 in time. The changes can be very slow (several month) or very quick (several hours). Regular peaks with 24 hour period are caused by quick measured quantity change (quick movement of measured vector end in measurement plane). The peeks have different cause added to basic cause only in those short time intervals. Basic cause of medium time variance is random difference from mean value.
Spectrum
Many spectral analyses of measured displacements give following results:
- Significant frequency spectral part has pink noise (1/f) nature.
- Spectrum contains 24hour, 12hour, 8hour and 6hour significant spectral lines
- Those spectral lines are time dependent
- Spectrum contains 1 year site spectral lines
Basic spectral characteristics are shown in figure 7 and 8.
Figure 6 – Total spectrum of measured displacements component L2-EW – May 2000 – October 2004.
Figure 7 – Total spectrum of measured displacements component L2-NS – May 2000 – October 2004.
Spectrum contains 4.80 hour, and 4.00 hour small spectral lines greater than surrounding noise level. 6hour spectral line has significant amplitude only in north-south component in L2 locality (L2-NS) (long-term spectral analysis could be made only in L1 and L2 localities).
Any spectral line greater than noise level, corresponding with the Moon time periods was not found.
Figure 8 – Selected spectrum parts of measured displacements component L2-EW – May 2000 – October 2004.
Figure 9 – Selected spectrum parts of measured displacements component L2-NS – May 2000 – October 2004.
All basic spectral lines are surrounded by site spectral lines showing 1 year period superposition. Small ½ year period superposition spectral lines can be seen too close some basic spectral lines (see figure 9 and 10).
Figure 10 – Spectral lines time dependency of measured displacements component L2-EW and L2-NS. Measured results were analyzed by STFT using 96 days wide Tukey window. Displayed time is in the middle of the window.
Time changes of spectral lines amplitude are great (minimum to maximum amplitude ratio is greater than 1:3) (see figure 11). It is possible to analyse different spectral lines ratio dependency. Figure 12 and 13 show relations between spectral lines of the same signals.
Figure 11 – 12 hour and 8 hour spectral lines ratios related to 24bour spectral line of measured displacements component L2-EW.
Figure 12 – 12 hour and 8 hour spectral lines ratios related to 24bour spectral line of measured displacements component L2-NS.
Spectral lines relations of measured displacements differs from spectral lines relations of nonlinear system. The relations are close to linear dependency between different spectral lines. It means that time dependency of higher harmonic spectral line is relatively close to time dependency of basic harmonic (24hour) spectrum. This fact implies the periodic part waveform shape of measured displacements has very small time dependency but amplitude or specific amplitude density or both are time dependent.
Periodic displacements
It is interesting to study time dependency of periodic component amplitude.
The 24hour amplitude must be separated from irregular component. The 24hour amplitude was computed as measured displacements variance in 24hour time interval. Results from L2 locality are shown in figure 14.
Figure 13 – Time dependency of measured displacements 24hour amplitude in L2 locality.
The result shows that 24hour period amplitudes have random nature with important season dependency. East-west component in L2 locality has greater average amplitude than north-south component. It is specific feature of L2 and some other localities. There are localities with opposite ratio between east-west and south-north components.
Trajectory
Measured displacements periodic component creates trajectories in horizontal plane.
Measured trajectories were frequently similar to slim ellipse. Size and orientation of the measured trajectories were very different.
Trajectories from all measured localities are in the figure 15. Time interval of every trajectory is different. Displayed results were not measured simultaneously.
Figure 14 – Measured
trajectory in all localities. Periodic movement is superpositioned with irregular movement. Time
periods with minimal influence of irregular superposition and maximal periodic
movement amplitude were selected from measured results. The measurement in
some localities did not enable select ideal time period and time period with
great irregular shift had to be selected. This is valid especially for localities
with small amplitude of periodic component.
Results from L9 and L13-L15
are very close to L2 results. Those results were not displayed to simplify the
figure.
Analogous 100x multiplied
trajectory of theoretical Newton’s tide acceleration vector TM is displayed
in upper left corner. The trajectory was computed for locality L1-L15. The
localities are close each other with respect of Newton’s tide acceleration,
that difference in tide acceleration vector trajectories can not be identified
in the figure.
The results show that trajectory orientation and shape differ in various localities. This feature is discussed in more detail in Reproducibility and Space Dependency part of the appendix.
Some trajectories have clear time dependency of circumferential velocity. Circumferential velocity can change its value with ratio more than 1:10 in 24hour time interval. Example of circumferential velocity time dependency is shown in figure 16.
Figure 15 – Time dependence of measured displacements circumferential velocity in L2 locality. Circumferential velocity was computed as measured trajectory vector change in 30min. (gravity gradient change) and recalculated to 1s.
Phase
Time position of measured displacements minimum or maximum value in the period (phase) does not differ very much in one locality. These positions are constant in whole measured time period – more than 4 years. No time dependent phase shift was recognised in majority of measured localities.
The phases differ in different localities. In some cases phases differ in different seasons in one locality (see Long-term dependences for details).
Measurement results show, that displacements phases are close each other in two separated “phase groups”. It is valid for north-south component and for east-west component as well.
Localities classified into phase groups with respect of average time of minimum or maximum displacements are in the table 1.
|
Locality |
Tmax North |
Tmin North |
Tmax East |
Tmin East |
Phase group |
|
L1 |
5 |
18 |
5 |
16 |
AA |
|
L2 |
4 |
14 |
15 |
9 |
AB |
|
L3 |
6 |
16:30 |
6 |
17:30 |
AA |
|
L4 |
17 |
6 |
? |
? |
B? |
|
L5 |
17 |
6 |
17 |
? |
B? |
|
L6 |
15 |
6 |
16 |
9 |
BB |
|
L7 |
16 |
8 |
14 |
8 |
BB |
|
L8 |
15 |
3:30 |
5:30 |
18 |
BA |
|
L9 |
4 |
14 |
15 |
9 |
AB |
|
L10 |
3 |
9 |
15 |
3 |
AB |
|
L11 |
17 |
6 |
18 |
7 |
BB |
|
L12 |
5 |
12 |
5 |
13 |
AA |
|
L13 |
8 |
15 |
15 |
8 |
AB |
|
L14 |
8 |
14 |
15 |
8:30 |
AB |
|
L15 |
7 |
14 |
15 |
7 |
AB |
Table 1 – Phase groups in different localities. Minimum or maximum time is in UTC.
Localities with different altitudes are:
|
L1+L10 |
|
L2(L9,L14)+L7 |
|
L5+L11(L12) |
Localities with only 1m different altitudes are:
|
L2(L9, L14) + L13(L15) |
See Reproducibility and Space Dependency part of the appendix for more detail locality description.
There exists time interval with no minimum or maximum displacement value during day in any locality. It is 18-03 hour UTC interval (9 hour interval). Irregular spreading of minimums and maximums decreases the interval size, but the effect still exists.
Very interesting results can be analysed from phase and orientation of measured trajectory.
Trajectory orientation is not the same in all localities. In some localities is the same like the virtual Sun orbit in the measurement plane (L3 and L6 localities). In some localities is trajectory orientation opposite to the virtual Sun orbit (L2, L7, L8, L9, L10 and L11 localities).
Phase comparison with respect to the Sun relative position on the sky in localities where measured trajectory orientation is equivalent with the Sun trajectory orientation is interesting.
Measured trajectory in L3 locality follows the Sun movement like pendulum weight was attracted by the Sun i.e. measured displacements tend to the Sun. Measured trajectory in L6 follows the Sun in opposition like pendulum weight was repelled by the Sun i.e. measured displacements tend from the Sun.
Measured trajectories with opposite orientation show different position of the same time interval trajectory segment with respect to the trajectory centre.
The conclusion must be deduced from the analyses: Measured displacements are not based on Newton’s gravity interaction between the weight and the Sun.
Space dependency
Space dependency is described in detail in Reproducibility and Space Dependency part of the appendix. The most important results of the issue are described in this section.
Measurements were made in 15 different localities. The locality positions vary each other in geographic positions and in altitude above surrounding terrain. Maximal distance between two localities was about 100km. Minimal distance was less than 1m. Locality altitude was from about -3m (3m below terrain level) to about 20m above terrain level. Some localities differ only in altitude. Some localities differs only in horizontal position and are very close each other. All localities were placed about 50° north latitude and 15°east longitude. See Reproducibility and Space Dependency part of the appendix for more detail locality description.
Significant similarities between simultaneously measured displacements in different localities were identified. It was not exact match between measured displacements. See Reproducibility and Space Dependency part of the appendix for details.
The altitude dependency was validated several times by simultaneous measurements in two localities with different altitude. Other localities coordinates were as close as possible.
L2 and L7 localities had the same geographic coordinates (in the same building one above the other in different floors). The only coordinate difference was in altitude. The L2 altitude is about 15m higher than L7 one. L1 locality is about 100 km far away. Figure 17 shows simultaneously measured results.
Figure 16 – Time dependence comparison of measured displacements in L1, L2 and L7 localities.
Figure 18 shows great difference in trajectories simultaneously measured in L2 and L7 localities.
Figure 17 – Synchronously measured trajectory in L2 and L7 localities.
Great difference in north-south component phase of measurement displacements is very important. The phase in one locality is nearly opposite to phase in the other locality.
East-west component phases are the same but measured displacements amplitude in L2 locality is about 3times greater than amplitude in L7 locality.
The results eliminate hypothesis that measured displacements can be caused by building tilt or surrounding terrain tilt.
Similar results were measured in L1 and L10 localities (altitude difference was about 5m) and L5, L11 and L12 localities.
Conclusions are: Strong altitude dependency of measured displacements. It is very important discovery.
Time dependency
This section describes analysis results of measured displacements time dependency in different time scales.
Long-term dependences
The first analysis deals with long-time stability of measured displacements trajectory in one locality.
Measured displacements results from L2 locality in selected days were used for the analysis.
The day selection criteria are:
- The day is close to astronomically important moment (equinox or solstice)
- The day with minimal weather change influence (sunny day without clouds)
Comparison results are in figure 19.
Figure 18 – Measured long-term trajectory dependency in L2 locality. Separate trajectories from different days are shifted by individual offsets. The offsets were selected only for the figure readability and have no physical meaning and no relation with irregular component.
The results show long-term time dependency of measured trajectory. The trajectories change during the time with one year period. This dependency is periodic and reproducible.
The trajectory changes its amplitude, orientation in the plane and shape.
The effect was identified in other locality too. See Reproducibility and Space Dependency part of the appendix for more details.
The figure 20 shows measured displacements in L2 locality from the same selected days only from equinoctial periods compared with selected external effects (external temperature and Sun radiation in L2 locality).
Figure 19 – Comparison of measured displacements and external effects in L2 locality in sunny days from equinoctial periods. Measured displacements L2-NS and L2-EW are shifted by individual offsets to enable good displaying in one graph. Sun radiation RA-uexp is standardized by constant parameter to enable display in one graph with other quantities.
Long-term comparisons of L2 results show that north-south component phase is changing during the year and east-west component phase is constant whole year. The phase change proceeds in equinox stage by signal with one phase amplitude increasing and signal with second phase amplitude decreasing. Two maximums and two minimums in one day exist in this time. The phase change is not caused by gradual phase shift or by phase jump.
Figure 21 and 22 show the situation example.
Figure 20 – Continuously measured displacements waveform change - L2 locality September 2003.
Figure 21 – Measured trajectory change in L2 locality - September 2004. Coordinate system and offsets in the figure are modified to enable easy comparison of trajectory with previous figure.
Detail comparison of external effects periodic components with measured displacements showed important relation between L2-EW measured displacements periodic component and some external effects quantities (see appendix C – “External Impacts” for details).
Following part of the paper deals with best related external quantities i.e. temperature T-ext, Sun radiation RA-uexp and Sun radiation time integral intRA-uexp relationship in L2 locality.
Analysis results are in table 2. 24hour periodic component amplitude of measured displacements and compared quantities were computed as 24hour variance of the signal (always in 00:00 – 24:00 UTC time interval).
|
|
L2-NS |
L2-EW |
RA-uexp |
|
T-ext |
0.502 |
0.855 |
0.846 |
|
RA-uexp |
0.531 |
0.878 |
|
|
intRA-uexp |
0.495 |
0.894 |
0.930 |
Table 2 – Correlation of selected external effects and measured displacements 24hour amplitude in L2 locality.
All results show good correspondence between 24hour amplitude of external effects and L2-EW measured displacements. The greatest correlation is between L2-EW and intRA-uexp.
The correlation is greater than correlation between Sun radiation amplitude (RA-uexp) and external temperature amplitude (T-ext). The table contains correlation between RA-uexp and intRA-uexp (two “images” of the same physical quantity) computed by the same method as other correlations for comparison.
L2-EW correlations are essentially greater than L2-NS correlations. It corresponds with appendix C - “External Impacts” conclusions based on spectral analysis.
The figure 23 displays the best relation together with season dependency.
Figure 22 – Correlation of integrated Sun radiation intRA-uexp and measured displacements 24hour amplitude in L2 locality. Selected seasons are displayed to show time dependency of correlation. The seasons were constructed this way: One year was divided into 4 seasons. Every season was symmetrical to the equinox or solstice. Season I is from 10th February to 9th May, season III is from 10th August to 9th November of corresponding year. Season IV is from 10th November of corresponding year to 9th February of the next year. Measured amplitudes intRA-uexp and L2-EW in selected season are displayed by the same graphical symbol.
The figure shows significant season dependency of ratio between measured displacements amplitude and integrated Sun radiation amplitude.
Figure 24 contains L2-EW and intRA-uexp correlations in different seasons in 3 years time interval.
Figure 23 – Correlation season dependence of intRA-uexp 24hour and L2-EW amplitude correlation in L2 locality. Every season was symmetrical to the equinox or solstice as described in previous figure caption.
The figure shows, that correlations in every season is better than total correlation except all autumn-winter seasons (season IV). It could be explained by the smallest 24 hour periodic component amplitude in the season and relatively greatest influence of irregular component superposition.
Time dependency of 24hour amplitude ratio between L2-EW measured displacements amplitude and Sun radiation integral (intRA-uexp) amplitude is in the figure 25.
Figure 24 – Time dependence of L2-EW to intRA-uexp 24 hour amplitudes ratios in L2 locality. The graph displays only selected days ratios:
- Sunny day – the day with full day sunny weather (without clouds),
- Over average – the day with both amplitudes greater than average amplitude.
Selected days must be used to minimise error influence of irregular component. Sunny days were selected to eliminate cloud shielding effect. Over average days were selected to minimize pink noise and measurement errors in small amplitudes ratio.
The results can be formulated:
- Amplitude ratio is not constant
- Amplitude ratio time dependency is periodical function
- Maximum to minimum values ratio of the function is greater than 2:1
- Time period is one year
- Maximum value is close to spring equinox, minimum value is close to autumn equinox
Short-term dependences
Short-term time dependencies are studied in following text.
L2-NS and L2-EW measured displacements component time relation with external temperature T-ext and Sun radiation RA-uexp in selected days were analyzed.
The days with rapid and strong weather change were selected from measured results.
Measured displacements with external effects time dependency from those days are displayed in figure 26 and 27. 3 minute averages are used in all short-term dependency figures.
Figure 26 – Short time dependency between measured displacements, external temperature and Sun radiation in L2 locality – day 29.9.2002 and 30.9.2002. Sun radiation graph scale respects measured displacements scale by constant coefficient to enable relative comparison. Measured displacements offsets were adjusted for readability of the figures.
The graphs show clearly time relation between Sun radiation and measured displacements. Both L2-EW and L2-NS measured displacements components changes theirs shapes in the weather change moment. It can be seen, that measured displacements shape differs in full Sun radiation time from the shape in low Sun radiation time (moderated by cloudiness).
It can be seen, that in some days in which external temperature T-ext does not follow sunshine time dependency (external air temperature was changed by another cause as well), measured displacements L2-NS and L2-EW do not follow external temperature change. The time connectivity with Sun radiation exists in all cases.
Reproducibility of the effect and relation to external quantities and internal temperature can be seen from figure 28. Three independent measuring devices placed in very near localities L2, L9 and L14 (distance about 1m and different measuring device orientation) simultaneously measured the gravity gradient time changes together with external quantities (external temperature and Sun radiation) and with internal temperature (in five points T-int, TA, TB, TC and TD) are shown.
Figure 27 – Short time dependency between simultaneously measured displacements, internal temperature, external temperature and Sun radiation in L2, L9 and L14 localities – day 1.9.2004 - 3.9.2004.
More detail information and more comparisons of measured data can be found in Reproducibility and Space Dependency part of the appendix.
The results implicate hypothesis: Sun radiation and measured displacements are affected by the common cause.
Cloudiness can be the common cause. The clouds between measurement locality and the Sun can cause Sun light radiation moderation simultaneously with measured displacements values modifications in L2 locality.
Sun radiation integral
Waveform time consistency and correlations results show greatest consistency between L2-EW and intRA-uexp computed from reconstructed Sun radiation RA-uexp by the equation (1):
![]() (1)
(1)
where ![]() is time constant relevant to
frequency characteristic breakage frequency,
is time constant relevant to
frequency characteristic breakage frequency, ![]() is angle speed
is angle speed ![]() .
.
Digitally filtered waveform intRA-uexp computed from measured Sun radiation RA-uexp in L2 locality using equation (1) above compared with simultaneously measured displacements L2-EW is shown in figure 29. Time interval was selected randomly to show small and great amplitudes in one figure.
The comparison verifies hypothesis, that measured displacements L2-EW are similar to Sun radiation time integral intRA-uexp and vice versa. The long time comparison shows, that one quantity is not directly dependent on the second quantity (see appendix C - “External Impacts” for details). The time dependent ratio must be respected too (as it was discussed in Long-term dependences).
Figure 28 – Comparison
of measured displacements time dependence L2-NS and computed time dependence
intRA-uexp ![]() =24hour.
Digitally filtered
waveform intRA-uexp was displayed with changed scale and offset to enable
comparison with L2-EW. Physical unit is different ([Jm-2]).
=24hour.
Digitally filtered
waveform intRA-uexp was displayed with changed scale and offset to enable
comparison with L2-EW. Physical unit is different ([Jm-2]).
The implications from the section are:
- Measured displacements L2-EW are very similar to the Sun radiation time integral in measurement locality (with respect of local building shielding effect).
- 24hour amplitude L2-EW to intRA-uexp ratio changes its value more than 1:2 during the year.
- Maximum value is close to spring equinox, minimum value is close to autumn equinox
- Amplitude ratio time dependency is periodical function with one year time period
- Measured displacements L2-EW and L2-NS reacts in very short time (in a few minutes) to weather change even in the room with concrete walls and no window.
Notes to implications:
- Cloudiness is probably common cause of measured displacement waveform change and Sun radiation change.
- Shielding effect of building and clouds can explain measured effects.
- Measurement device was placed in the room with minimally 25 cm wide ferroconcrete walls without any window. It means that measured quantity must pass through the concrete walls in time shorter than a few minutes.
Measured results conclusions
Identified measuring device features and limits
Measuring device design and real manufacture cause following measuring device feature and limits:
- Measuring device is design to measure gravity vector interaction in horizontal plane by one sensor in two orthogonal coordinates (see appendix A – “Measuring Device and Measurement Method”).
- Measuring device was design as very cost effective solution for basic measurement of unknown gravity interaction component with unknown features. No knowledge about measured quantity could be used for measuring device precision increasing. Only basic precision level is used to enable identify existence of the interaction and qualitative description of effects.
- Measuring device short-term precision was estimated about +- 10%. It includes calibration errors, thermal expansion error in closed room conditions, digital quantization error and measuring device parts nonlinearity.
- Measuring device long-term precision can be influenced by additional offset error caused by autocalibration digital quantization error and by unreliable autocalibration.
- Every measurement result is independent on the previous value. Smooth character of measured quantity enables location of unreliable autocalibration and backup measuring device results enable correction of measuring device parameters or correction of measured raw results. Only a few result corrections were needed after measuring device parameters initial tuning (see appendix A).
- The error caused by thermal expansion of measuring device was lower than 3% in the experiment (for high amplitude displacements with 24hour period). It was verified for L2, L9, L13, L14 and L15 localities (see Reproducibility and Space Dependency part of the appendix) and compared successfully with theoretical value estimated in appendix A.
- Measured displacements are caused by external vector physical quantity. The simultaneously measured results from differently oriented measuring devices in near localities transformed into geographical coordinates are very similar. Raw measured results are very different (see Reproducibility and Space Dependency part of the appendix).
- External dominant impacts of many physical quantities were analysed and excluded (see appendix C – “External Impacts”).
Measured results reproducibility and disinteresting
Very important question is reproducible and disinterested measurement:
- Measuring reproducibility was successfully verified by simultaneously measurement in very near localities (distance between localities was about 1 m) (see Reproducibility and Space Dependency part of the appendix).
- It is not possible expect reproducible results in repeated measurement in different times. Measured quantity includes high level of irregular component.
- It is not possible to expect reproducible results in more distant localities. Measured quantity is strongly dependent on very near surroundings. The dependency is unknown (see Reproducibility and Space Dependency part of the appendix).
- Measurement objectivity was verified by long-term measurement by three independent measuring devices in 15 localities (see Reproducibility and Space Dependency part of the appendix).
- All measurement devices was designed, manufactured and operated by only one person; all results were processed and analysed, and conclusion was made only by the same person. Possible subjective error or unrecognised systematic error was not excluded.
It was not possible to create human controlled reproducible experiment condition. Measured quantity has unknown features. The existence of the quantity was unknown. Speculations, working hypothesis or unproved theory only could be used for human controlled experiment design and execution in that case. Now it is unknown, if it is possible to design and execute those human controlled reproducible conditions for the experiment and how can be the experiment complex and if it is technologically possible.
Identified measured results summary
Identified measured displacements features can be summarised:
- Time dependent physical quantity which interacts with pendulum weight was repeatedly measured in all different localities and by different measurement devices.
- The physical quantity was measured in the horizontal plane i.e. in the plane tangential to the reference ellipsoid in the measurement point.
- The measured physical quantity is external time dependent vector. Measured physical quantity interaction with the weight mass is equivalent to gravity gradient direction change.
- Two basic components of measured quantity was recognized:
- Irregular, random or pseudorandom component with continuous spectrum inversely proportional to frequency (1/f) which can be supposed as a pink noise.
- Periodic component with basic period 24.00 hour and seemingly random amplitude.
Following features of periodic component was identified:
- Amplitude:
- Displacements amplitude can be greater than 3x10⁻⁵ of standard gravity acceleration, thus 3x10⁻⁴ ms-2 i.e. angle aberration can be greater than 3x10⁻⁵ radian, thus 6” (angle second). It is more than 100times greater value than maximal Newton’s tide generation force amplitude. It is more than 5% of Newton’s gravity acceleration of the Sun on the Earth.
- Amplitude is not constant. Amplitude is time dependent. Amplitude time dependency includes irregular time dependency and periodic amplitude dependency with annual time period.
- Spectrum:
- Spectrum of measured displacements contains basic period of 24.00 hour (15 deg per hour) and important spectral lines with period of 12.00 hour (30 deg per hour), 8.00 hour (45 deg per hour) and 6.00 hour (60 deg per hour). No spectral lines greater than noise with period matching the Moon movement was identified.
- All periodic components spectral lines are time dependent. Time dependency period is one year.
- Spectrums of orthogonal components can be different. They differ in spectral lines existence and in spectral lines time dependency.
- Phase:
- Periodic component phase has specific behaviour. Phase can change significantly with respect of locality or time. Phase is very stable in long time period. Very different phases in different localities and different components were measured. Maximums and minimums of measured displacements time positions enable grouping into “phase groups”. Time interval with no maximum or minimum was identified in all measured results.
- Opposite phases can be identified in relatively close localities (a few meters altitude difference).
- Phase change during year was identified only in one locality and only in one direction component. The phase changes were measured twice a year. The phase change is based on amplitude change of two synchronous signal components with shifted phases. No phase jump or phase movement was identified.
- Trajectory:
- Periodic component trajectories in horizontal plane match pendulum weight attraction by the Sun in some localities and pendulum weight repulsion by the Sun in other localities. Trajectories with opposite movement orientation than the Sun relative movement were measured in some other localities.
- Trajectories are similar to more or less deformed ellipse in many localities. Trajectory circumferential velocity is time dependent in several localities. Waveforms don’t need to be symmetrical.
- Time dependency:
- Periodic component pseudorandom nature is similar in different localities (similar small and great amplitude sequences). The similarities between more than several tens of km distant localities were identified; even so measurement displacements can be different in many other attributes (e.g. phase difference, different irregular component value or shape, only one axis similarity).
- Annual reproducible periodic change of measured displacements in L2 locality was recognised (trajectory orientation, size and shape change). Season dependent change was repeatable recognised in all localities where relevant measurement was made.
- Space dependency:
- Significant dependency on locality and especially strong dependency on altitude above terrain were identified. Altitude difference of few meters (5 -15 m) caused significant difference in measured displacements. Altitude difference 1m can give recognisable difference in measured displacements.
- Significant building influence to measured displacements similar to shielding was identified.
Some regularity was recognised in irregular component. Following features of irregular component was identified:
- Short-term time events:
- Measured displacements waveform have significant events in relatively very close time (in less than several minutes) to change of Sun radiation in the measurement locality. The events repeatedly exist even though the measuring device is separated from the Sun by minimally 25 cm thick ferroconcrete walls.
- The events exist in times of start or end of Sun radiation shielding (caused by the building) in sunny days. The events are missing in cloudy days.
- The events exist in times of rapid Sun radiation change caused by clouds in days with changing weather. Every rapid Sun radiation change in irregular time has synchronous measured displacements event.
- The reaction is not directly connected with the Sun radiation direction. It coheres with total Sun radiation amplitude.
- Long-term irregularity:
- No reliable long term dependency of the measured displacements irregular component was found. Annual period can be unreliable identified in L2-NS component. The measurement results can be significantly corrupted by accumulated offset errors in that long-term measurement.
- Correlation:
- The greatest correlation exists between measured displacements L2-EW and Sun radiation integral in L2 Locality. The correlation value is higher than 0.9 in ¾ of annual period. Correlation value is about 0.8 in winter solstice season.
- Measured displacements amplitude to Sun radiation integral amplitude ratio changes its value with annual period in range about 1:2.
- Equivalent significant correlation does not exist in measured orthogonal component in the same locality.
- Relation to other irregular quantity:
- All other compared external quantities have no reliable relations with measured displacements.
- Reproducibility:
- No similar irregular displacements can be reliable measured by one measuring device in different time.
- Irregular component is included in measured physical quantity and has vector character in all localities.
- All simultaneously running measuring devices in near localities give similar results of short-term and medium-term irregular component independently on the measuring device orientation. No long-term experiment was made to test long-term irregular component reproducibility.
Rational conclusion comments
Measuring device design was motivated to enable Earth gravity gradient direction time dependency measurement.
No other explanation of measured results was found by the author. All other working hypothesis explaining measured results by other physical quantity was eliminated by results comparing (see appendix C for details).
All usually measured accessible physical quantity with similar features were selected and compared. Author does not know any other physical quantity with similar features which can be successfully compared with measured results. It does not exclude existence of the quantity.
Temperature dependency
Special attention was paid to temperature dependences analysis. Impact of temperature in measuring device area (impact to the measuring device) and external temperature in near surrounding of measuring area (impact to the building) were analysed.
Internal temperature impact was analysed by different methods:
- Black box analysis with different working hypothesis from linear dynamic system across nonlinear static system to nonlinear dynamic system were made (see appendix C)
- Special experiment with solid base were executed (see Reproducibility and Space Dependency part of the appendix)
- Theoretical estimation of thermal expansion coefficient of measurement device (see appendix A)
- Near locality experiment with differently oriented measuring devices gives very similar results transformed into geographical coordinate system but very different results in measuring device coordinate system (see Reproducibility and Space Dependency part of the appendix).
All analysis methods give results without conflict. All analysis supports conclusion about small impact of internal temperature to measured results in locality with commonly accessible thermal insulation. Only results from localities without thermal insulation must be selected as quantitative unreliable.
External temperature impact was analysed by following different methods:
- Black box analysis with different working hypothesis from linear dynamic system across nonlinear static system to nonlinear dynamic system were made (see appendix C)
- Statistical analysis (correlation) between 24 hour amplitudes of measured displacements and external temperature gives worse results than the same analysis with Sun radiation and Sun radiation integral (see Measured Results part of the appendix).
- Measurement area thermal time parameters analysis (minimally 300 hours) (appendix C)
- Measured time delay between external temperature events and internal temperature events (about ½ day) (Reproducibility and Space Dependency part of the appendix)
- Time analysis of delays between external temperature events and measured displacement events (time variable delay from several minutes to a few hours in one day) (Reproducibility and Space Dependency part of the appendix)
- Measured displacements are vector with different spectrum in orthogonal component (see 6 hour spectral line in the paper text and appendix C). Temperature is scalar.
- Differently oriented measuring devices fastened to differently oriented walls gives very similar results transformed into geographical coordinate. The differently oriented walls heated by the same external temperature must be deformed relatively to the wall orientation. Differently oriented walls are heated by Sun radiation in different times (see Reproducibility and Space Dependency part of the appendix).
- Measured displacement amplitude to external temperature amplitude ratio is not time constant. It can change its value in range more 1:2 in about one month (see “Building deformation impact” in appendix C).
All analysis methods give results without conflict. Some time similarity between external temperature in near surroundings and measured displacements component was recognized. Direct causal dependency between external temperature and measured displacement was eliminated. Common cause or partially common cause of measured displacements and measured external temperature was not eliminated.
Sun radiation
Very important role of Sun radiation was identified with respect of measured displacements. Sun radiation time integral in the measuring device locality gives the best correspondence with one measured displacements component from all compared quantities. It was validated by several independent analyses:
- Black box spectral and noise analysis of measured data (appendix C)
- Statistical analysis (correlation) (Measured Results part of the appendix)
- Short-term time events analysis (both parts of the appendix)
- Numerically integrated Sun radiation and measured displacements time dependence comparison (Measured Results part of the appendix)
All analysis gives the same results. The best agreement is between East-West component of measured displacements in L2 locality and time integral of Sun radiation amplitude in L2 locality. Comparison with North-South component of the simultaneously measured displacements gives totally different results. Only short-term irregular synchronous events can be reliably recognized in L2-NS component.
Sun-Earth system
The measured quantity is vector dependent on Sun-Earth movement. The following effects support the idea:
- Basic time periods are 24:00 hour and 1 year (Measured Results part of the appendix),
- The trajectory in horizontal plane is similar to ellipse in some localities (trajectory width space dependency or memory effect) (both parts of the appendix),
- Season dependency of trajectories (both parts of the appendix),
- Existence of high spectral lines in measured quantity spectrum and time dependence of the spectral lines (both parts of the appendix),
- Spectral line ratio amplitude dependency excluding nonlinear effects (both parts of the appendix),
- Time coincidence with relative Sun position (both parts of the appendix),
- Different spectrums in different coordinate axes (both parts of the appendix and appendix C),
- Independency on measuring device orientation (Reproducibility and Space Dependency part of the appendix).
The Sun-Earth system movement can not explain all measured quantity features. Additional effects must be taken into account.
Shielding effect
Locality surrounding influence was proved by the measured results analysis. Sun radiation in measurement locality is influenced by the building geometry. The Sun radiation including building shielding effect gives better agreement with measured displacements than Sun radiation without shielding effect. It is valid for digitally modelled Sun radiation too. It can be derived from analysis:
- Spectral analysis of modelled Sun radiation without and with building shielding effect compared with measured displacements spectrum (SS and SSS - see appendix C)
- Spectral analysis of measured Sun radiation from relatively close localities without shielding effect (RA-chmi) and with shielding effect (RA-uexp) compared with measured displacements spectrum (see appendix C)
- Timing analysis of measured displacements events with ideal and real measured Sun radiation in measurement locality (both parts of the appendix)
All analyses give results without conflict, all analysis supports the same conclusion.
Shielding effect hypothesis and measured results enable quantitative estimation of one material shielding coefficient value. Estimated building material (concrete) shielding penetration depth is 30-80cm (measured displacements interaction is ½ of original value in depth 30-80cm of concrete layer) (Reproducibility and Space Dependency part of the appendix). The value can explain the following facts:
- Rapid decreasing of 24 hour periodic component value in localities under terrain level (L4, L5)
- Problems connected with S1 “error wave” in continental tides measurements in insufficiently deep localities [18] (“Error wave” amplitude is about 10-3 of measured quantity in deep more than 20m in some cases i.e. shielding penetration depth can be about 2m in some cases).
The all measured displacements features can not be explained by only “Sun radiation like” shielding effect. Other effect or more complicated shielding must be considered.
The effects supporting the idea exist:
- Significant altitude dependency, namely phase dependency (Reproducibility and Space Dependency part of the appendix).
- Trajectory and waveform differences in simultaneously measured displacements in near localities in sunny days can (Reproducibility and Space Dependency part of the appendix)
- Opposite trajectory directions in different localities (Reproducibility and Space Dependency part of the appendix).
- Measured displacements gradient change in times with no Sun radiation (during some nights) (Reproducibility and Space Dependency part of the appendix)
Simple shielding effect can explain only part of measured features.
Electromagnetic interaction
Direct Sun radiation i.e. electromagnetic waves can not be direct cause of measured displacements. The effects excluding the idea exist:
- Repeatedly measured season dependence of measured displacements is in conflict with Earth-Sun geometry (different waveforms and trajectories in spring and autumn equinox but Earth-Sun symmetrical geometry) (Measured Results part of the appendix)
- Radically changing ratio between Sun radiation amplitude integral and measured displacements amplitude in range about 1:2 with annual period. (Measured Results part of the appendix)
- Similarity of time integral of Sun radiation (waveform and noise) with measured displacements. No direct similarity between Sun radiation and measured displacements (quick changes against gradient changes, white noise against pink noise) (both parts of the appendix)
- The fact that the weight is made from electromagnetic neutral material (appendix A) and measurable displacements exist.
- Repeatedly measured synchronous displacements of the concrete weight in closed room insulated from the Sun by concrete walls (both parts of the appendix).
- Measured displacements direction does not correspond with Sun-weight direction. The orientation of trajectory in horizontal plane does not correspond in some localities with virtual trajectory orientation of Sun (Reproducibility and Space Dependency part of the appendix)
The every effect is in conflict with idea of direct interaction of measuring device with Sun by electromagnetic effect. No effect is in conflict with idea of unknown gravity interaction.
No other explaining by other known physical quantity was found.
The idea of unknown gravity interaction is not in conflict with known experimentally proved physical laws.
Reproducibility and Space Dependency
This part describes measured results from different experiments and different localities. Measured results analysis was motivated to prove or exclude hypothesis about repeatable measurement of unknown irregular quantity.
The same measured results were used to find space dependency of unknown quantity.
Waveform
The section shows time dependency of measured displacements in different time periods and in different localities. The time periods were selected to enable comparison between localities and between the same seasons of different years.
The basic time periods were selected randomly and they are only a small fraction of total time interval.
Measured results only from selected localities are shown in this section.
Figure 29 – Time dependence of measured displacements in L2 locality – August 2000.
Figure 30 – Time dependence of measured displacements in L2 locality – August 2001.
Figure 31 – Time dependence of measured displacements in L2 locality – August 2002.
Figure 32 – Time dependence of measured displacements in L2 locality – August 2003.
Figure 33 – Time dependence of measured
displacements in L2 locality – August 2004.
Figure 34 – Time dependence of measured displacements in L2 locality – December 2000.
Figure 35 – Time dependence of measured displacements in L2 locality – December 2001.
Figure 36 – Time dependence of measured displacements in L2 locality – December 2002.
Figure 37 – Time dependence of measured displacements in L2 locality – December 2003.
Figure 38 – Time dependence of measured displacements 30min. variance in L2 locality – August 2000.
Figure 39 – Time dependence of measured displacements 30min. variance in L2 locality – August 2001.
Figure 40 – Time dependence of measured displacements 30min. variance in L2 locality – August 2002.
Figure 41 – Time dependence of measured displacements 30min. variance in L2 locality – August 2003.
Figure 42 – Time dependence of measured displacements 30min. variance in L2 locality – August 2004.
Figure 43 – Time dependence of measured displacements 30min. variance in L2 locality – December 2000.
Figure 44 – Time dependence of measured displacements 30min. variance in L2 locality – December 2001.
Figure 45 – Time dependence of measured displacements 30min. variance in L2 locality – December 2002.
Figure 46 – Time dependence of measured displacements 30min. variance in L2 locality – December 2003.
Figure 47 – Time dependence of measured displacements in L1 locality – August 2000.
Figure 48 – Time dependence of measured displacements in L1 locality – August 2001.
Figure 49 – Time dependence of measured displacements in L1 locality – August 2002.
Figure 50 – Time dependence of measured displacements 30min. variance in L1 locality – August 2000.
Figure 51 – Time dependence of measured displacements 30min. variance in L1 locality – August 2001.
Figure 52 – Time dependence of measured displacements 30min. variance in L1 locality – August 2002.
Figure 53 – Time dependence of measured displacements in L3 locality – August 2001.
Figure 54 – Time dependence of measured displacements 30min. variance in L3 locality – August 2001.
Figure 55 – Time dependence of measured displacements in L6 locality – June 2002.
Figure 56 – Time dependence of measured displacements 30min. variance in L6 locality – Jun 2002.
Figure 57 – Time dependence of measured displacements in L8 locality – May 2003.
Figure 58 – Time dependence of measured displacements 30min. variance in L8 locality – May 2003.
Figure 59 – Time dependence of measured displacements in L11 locality – September 2003.
Figure 60 – Time dependence of measured displacements 30min. variance in L11 locality – September 2003.
Figure 61 – Time dependence of measured displacements in L8 locality – May 2004.
Figure 62 – Time dependence of measured displacements 30min. variance in L12 locality – May 2004.
Spectrum
Total spectrum can be computed only from L1 and L2 localities where long-time measurements were made. Spectrums were computed by FFT [5].
Figure 63 – Total spectrum of measured displacements component L2-EW – January 2001 – December 2002.
Figure 64 – Total spectrum of measured displacements component L2-EW – September 2000 – September 2004.

Figure 65 – Total spectrum of measured displacements component L2-NS – January 2001 – December 2002.
Figure 66 – Total spectrum of measured displacements component L2-NS – September 2000 – September 2004.
Figure 67 – Total spectrum of measured displacements component L1-EW – January 2001 – December 2002.
Figure 68 – Total spectrum of measured displacements component L1-NS – January 2001 – December 2002.
Figure 69 – Spectral lines time dependency of measured displacements component L2-EW and L2-NS. Analyzed by STFT using Tukey window 96 days wide [6, 7]. Displayed time is in the middle of the window.
Figure 70 – Spectral lines time dependency of measured displacements component L1-EW and L1-NS.
Spectral line time dependency analysis shows considerably high maximum to minimum amplitude ratio (more than 3:1). This ratio enables to study different spectral line proportions in one signal.
Figure 71 –12 hour and 8 hour spectral lines ratios related to 24bour spectral line of measured displacements component L2-EW.
Figure 72 –12 hour and 8 hour spectral lines ratios related to 24bour spectral line of measured displacements component L2-NS.
Figure 73 –12 hour and 8 hour spectral lines ratios related to 24bour spectral line of measured displacements component L1-EW.
Figure 74 – 12 hour and 8 hour spectral lines ratios related to 24bour spectral line of measured displacements component L1-NS.
Periodic displacements
Measured displacements have two basic components: periodic and irregular.
Periodic displacements have 24hour basic period.
This section shows analysis results of 24hour period amplitude time dependency. The 24hour amplitudes were computed as value of deviation in 24 hour time period.
Figure 75 – Time dependency of measured displacements 24hour amplitude in L2 locality.
The analysis results show seemingly random nature of 24 hour amplitude. The amplitude shows great season dependency.
Amplitudes in east-west direction are greater than in north-south direction in L2 locality.
This feature is specific for L2 and some other localities. Opposite ratios were measured in other localities.
Long-term seasonal dependency can be recognized from L1 measured displacements analysis too. Measurement time period in all other locality was too short to enable seasonal dependence evaluation.
Figure 76 – Time dependency of measured displacements 24hour amplitude in L1 locality.
Trajectory
Measured displacements create trajectory in the ideal Earth surface (more precisely in the tangential plane to ideal ellipsoid in measurement point).
The measured trajectories were similar to more or less deformed ellipse. Trajectory dimensions, orientations and shapes differ from each other in different localities.
Selected time period trajectories from all localities are in following figure.
Figure 77 – Measured
trajectories in L1-L12 localities. Periodic movement is superpositioned with irregular
movement. Time periods with minimal influence of irregular superposition and with
maximal amplitude of periodic movement were selected. The measurement in some
localities were not long enough to enable select ideal time period and time
period with relatively great shift had to be selected. This is valid especially
for localities with small amplitude of periodic component. Results from L9 and
L13-L15 are very close to L2 results.
Analogous 100x multiplied trajectory of theoretical Newton’s
tide acceleration vector TM is displayed in upper left corner. The trajectory
was computed for locality L1-L15. The localities are close to each other with
respect of Newton’s tide acceleration, that difference in
tide acceleration vector trajectories can not be identified in the figure.
Some trajectories show great time dependency of circumferential velocity. The circumferential velocity is not constant and can change its value more than 1:10 in 24 hour.
Figure 78 – Time dependence of measured displacements circumferential velocity in L2 locality. Circumferential velocity is computed as measured trajectory vector change in 30min. (acceleration change) and recalculated to 1s.
Figure 79 – Time dependence of measured displacements circumferential velocity in L3 locality.
Figure 80 – Time dependence of measured displacements circumferential velocity in L6 locality.
Figure 81 – Time dependence of measured displacements circumferential velocity in L8 locality.
Figure 82 – Time dependence of measured displacements circumferential velocity in L11 locality.
Figure 83 – Time dependence of measured displacements circumferential velocity in L12 locality.
Phase
Time position of measured displacements minimums and maximums amplitudes (phase) is close to fixed time in one locality. These positions are constant in whole measured time period – more than 4 years. No time dependent phase shift was recognised in majority of measured localities.
The phase considerably differs between localities.
Time position of measured displacements maximums and minimums values can slightly differ every day. The position shifts around mean value is caused mainly by influence of irregular component superposition.
The phase comparison shows some similarities between measured displacements phases. Two phase groups can be identified in every direction component (NS and EW). The phases in every group are very similar to each other. The phase differences between groups are great.
Figure 84 – Measured displacements phase (EW component) in A phase group localities. Time axis is calibrated in UTC. Local time = UTC + 1hour. Results of measured displacements were multiplied by constant coefficient and shift by offset to display similar amplitudes in figure and to enable phase comparison. The coefficient and offset were individual for every locality. The displayed time periods were not measured simultaneously. They were selected from measured results to enable good phase comparison.
Figure 85 – Measured displacements phase (EW component) in B phase group localities.
Figure 86 – Measured displacements phase (NS component) in A phase group localities.
Figure 87 – Measured displacements phase (NS component) in B phase group localities.
All localities where measurements were made
were analysed. 24 hour period amplitude in L4 and L5 localities are very low.
The periodic component is superposed with relatively great random
displacements. The results can not be used for reliable phase analysis. L9,
L13, L14 and L15 localities are not included in phase analysis. They are very
near to L2 locality and measured displacements show the same or very close phase
as L2 locality (see chapter “Near locality measurements” and “
Time dependency” for more details).
Maximums and minimum values time moments in UTC and phase group membership in different localities are in following table.
|
Locality |
Tmax North |
Tmin North |
Tmax East |
Tmin East |
Phase group |
|
L1 |
5 |
18 |
5 |
16 |
AA |
|
L2 |
4 |
14 |
15 |
9 |
AB |
|
L3 |
6 |
16:30 |
6 |
17:30 |
AA |
|
L4 |
17 |
6 |
? |
? |
B? |
|
L5 |
17 |
6 |
17 |
? |
B? |
|
L6 |
15 |
6 |
16 |
9 |
BB |
|
L7 |
16 |
8 |
14 |
8 |
BB |
|
L8 |
15 |
3:30 |
5:30 |
18 |
BA |
|
L9 |
4 |
14 |
15 |
9 |
AB |
|
L10 |
3 |
9 |
15 |
3 |
AB |
|
L11 |
17 |
6 |
18 |
7 |
BB |
|
L12 |
5 |
12 |
5 |
13 |
AA |
|
L13 |
8 |
15 |
15 |
8 |
AB |
|
L14 |
8 |
14 |
15 |
8:30 |
AB |
|
L15 |
7 |
14 |
15 |
7 |
AB |
Table 3 – Phase groups in different localities. Minimum or maximum time is in UTC.
Localities with different altitudes are:
|
L1+L10 |
|
L2(L9,L14)+L7 |
|
L5+L11(L12) |
Localities with only 1m different altitudes are:
|
L2(L9, L14) + L13(L15) |
There exists time interval with no extreme value (minimum or maxim) during day in any locality. It is 18-03 hour UTC interval (9 hour interval). Spreading of minimums and maximums by noise decreases the interval size, but the effects still exists.
Comparison of phase in trajectory is interesting. It is shown in following figure. The figure shows trajectory from one selected day only (0:00 – 23:30) in 30 minute steps from selected locality (locality with great periodic component). This full trajectory is named Lx. The partial trajectory from the same day (6:00 – 12:00) is displayed by other colour and named Lx-. This time asymmetry shows rotation direction and phase with respect of the Sun relative position.
Figure 88 – Measured 24hour trajectories with displayed phase.
All localities with significant periodic displacement trajectories were displayed in the figure. L4 and L5 locality was not displayed. Measured displacements contain very low amplitude of periodic displacements superpositioned with noise. L9, L13-L15 was not displayed too. All these localities are very near to L2 locality; trajectories are similar and can only complicate the figure. See “Near locality measurements” for details.
The results are:
- Measured trajectories in some localities have the same rotation direction as direction of virtual Sun movement on the sky (L3 and L6)
- Measured trajectories in some other localities have opposite rotation direction to direction of virtual Sun movement on the sky (L2, L7, L8, L9, L10 and L11)
- Measured trajectory in L3 locality follows virtual Sun movement on the sky like the measurement weight is attracted by the Sun
- Measured trajectory in L6 locality follows virtual Sun movement on the sky like the measurement weight is repelled by the Sun (opposite phase against L3 locality)
- Measured trajectory phase in localities with opposite rotation against the Sun virtual movements have different value each other. The partial trajectory (6:00-12:00) is in L2 and L9 localities in southwest direction from centre, in L7 and L11 localities in southeast direction from centre, in L8 locality in northeast direction from centre and in L10 locality in south direction from centre.
- Measured trajectories have 24 hour period in all localities. No trajectory with 12hour or other period was observed.
Conclusion is: Measured displacements can not be explained by Newton’s gravity interaction between measurement weight and the Sun in many localities.
Space dependency
Relative positions of all localities are in following table.
Table 4 – Localities relative positions. Approximate altitude above terrain is in the table. Measurement device is placed inside a building and terrain surrounding the building has complicated shape in some localities. Terrain shape projection into the measuring device locality inside the building can differ more than 1 m in different directions.
Reference locality is placed about 50° north latitude a 14° east longitude.
L2, L6, L7, L8, L9, L13, L14 and L15 are the closest localities to each other. Maximal relative distance is about 2 km in this group of localities. L9, L13, L14 and L15 localities are in the same place as L2 locality and were used for reproducibility verification. The distance between L2 and L9 was about 1m horizontally. L2 locality is in considerably higher latitude than all other localities (except L9, L13, L14 and L15).
L2 and L7 differ only in altitude about 15m.
L4 and L5 are in medium distance (less than 10 km) from the closest locality group. L4 is about in the same distance from L2 as L5 but in about opposite direction.
L3 is in about twice distance as L4 from L2 and about in the same direction.
L1 and L10 are in maximum distance from other localities (about 100km). L10 is in the same building like L1 but about 5m higher.
L11 and L12 are in the same building as L5, but about 6m higher. L11 is on opposite site of the same wall as L12. L11 and L12 are in the same altitude and in the same temperature conditions. Space surrounding both wall sites is continuous with no temperature insulation.
L8, L10, L11 and L12 localities was not placed in area thermally insulated from external temperature. The mean 24hour amplitude of external temperature is about 3.5°C. The measured displacements in the localities are much more influenced by thermal expansivity of measuring device than in other localities and the results can not be used as quantitative reliable results.
We can compare simultaneously measured results in different localities and consider experiment reproducibility. Measurement results from different localities are in following sections.
L1, L2 and L3 localities
Figure 89 – Time dependence comparison of measured displacements in L1, L2 and L3 localities – EW components.
Figure 90 – Time dependence comparison of measured displacements in L1, L2 and L3 localities – NS components.
L3 locality is placed between L1 and L2 localities.
Time dependence of measured displacements in east-west direction in L3 locality is similar to the time dependence of measured displacements in east-west direction in L1 locality. Time dependence of measured displacements in east-west direction in L2 locality is different from L1 and L3 ones.
The situation in north-south direction components is different. Time dependency of measured displacements in L3 locality is similar to time dependency of measured displacements in L2 locality. Time dependency of measured displacements in L1 locality is different from L2 and L3 ones.
L1, L2 and L6 localities
Figure 91 – Time dependence comparison of measured displacements in L1, L2 and L6 localities.
Time dependence of measured displacements from L2 and L6 localities are very similar. It is valid for NS direction and for EW direction as well. Measured displacements from L1 locality are different from other ones.
L2 and L6 locality are close each other (about 1.2km) and both ones are far away from L1 locality (more than 80km).
L1 altitude is lowest, L2 altitude is medium and L6 altitude is the highest.
Similarity between measured displacements from L2 and L6 localities can be seen from correlations of 24hour amplitude periodical components.
Figure 92 – Correlations of measured displacements 24hour amplitude in L2 and L6 localities.
The best correlation is between L2-EW amplitude and L6-NS amplitude (about 0.76). Little bit lower correlation is between L2-EW amplitude and L6-EW amplitude (about 0.70). Correlation between L2-NS amplitude and L6-NS amplitude is about 0.40. Irregular component superposition errors and measurement errors are included in correlated time series.
L1, L2 and L7 localities
Similar conclusions can be derived from measured displacements in L1, L2 and L7 localities.
Figure 93 – Time dependence comparison of measured displacements in L1, L2 and L7 localities.
L2 and L7 localities have exactly the same geographic coordinates; the only difference is in altitude. They are placed in the same building directly one above the second in different floors. The opposite phase of north-south components is very interesting and surprising result.
Great difference is in east-west components. The phases are equivalent but L2-EW amplitude is more than 3times greater than L3-EW one.
Great difference in simultaneously measured displacements trajectories can be seen from following figure.
Figure 94 – Simultaneously measured trajectory in L2 and L7 localities. Altitude difference between L2 and L7 localities is about 15m.
The conclusion is: Measured displacements are strongly dependent on altitude above terrain of measurement device.
Possible building tilt is in conflict with this result. Building tilt must be the same in different altitudes.
L1, L2 and L8 localities
Measurements in L8 locality were made in two time intervals. The first measurement was in autumn 2002. The second measurement was in spring 2003. Measured displacements from both time periods are in the following figures.
Figure 95 – Time dependence comparison of measured displacements in L1, L2 and L8 localities.
The best agreement is between L2-EW and L8-NS measured displacement components.
Figure 96 – Time dependence comparison of measured displacements in L1, L2 and L8 localities – repeated measurement.
This repeated experiment gives similar results.
L1, L2 and L10 localities
This experiment repeated altitude dependency measurement in quite different locality.
L10 locality is very close to L1 locality with different altitude (about 5m higher). L1 and L10 localities are more than 80km from L2 locality.
Figure 97 – Time dependence comparison of measured displacements in L1, L2 and L10 localities.
The results show very clear difference between measured displacements in L1 and L10 localities. There is interesting correspondence between L10 and L2 measured displacements. The best correspondence is between L2-EW and L10-EW.
Simultaneously measured displacement trajectory from L1 and L10 localities are in following figure to illustrate altitude dependency of measured displacements.
Figure 98 – Simultaneously measured trajectory in L2 and L10 localities.
Those results repetitively support conclusion from L2 and L7 measurement results. It is: Measured displacements are strongly dependent on measurement device altitude above terrain.
L2, L11 and L12 localities
Two measuring devices were placed into very near localities L11 and L12. The both localities were close to L5 locality in the same building about 4m above terrain level. L5 locality was about 2m under terrain level.
L11 was placed on the same wall as L12 but on the opposite site of the wall. The distance between L11 and L12 weights was about 0.7m. L11 and L12 was in very similar thermal conditions, no thermal insulator was between L11 and L12 localities. No direct Sun radiation was in both localities. No thermal insulation from outdoor air was used. L11 and L12 locality were placed directly under ceramic tile roof.
Measured results with and without thermal expansivity correction are on the following figures.
Figure 99 – Time dependence comparison of measured displacements in L2, L11 and L12 localities –EW direction.
Figure 100 – Time dependence comparison of measured displacements in L2, L11 and L12 localities –EW direction.
Displayed waveforms L11-EW, L12-EW, L11-NS and L12-NS include numeric compensation of measuring device thermal expansivity using measured temperature and experimentally measured thermal expansivity coefficient of measuring device. L11-EW-uncomp, L12-EW-uncomp, L11-NS-uncomp and L12-NS-uncomp display measured displacements with no compensation.
Measured displacements from L5 locality are displayed for comparison on following figure.
Figure 101 – Time dependence of measured displacements in L5 locality – April 2002.
Simultaneously measured trajectories in L11, L12 and L2 localities together with L5 trajectory measured in other time are on following figure.
Figure 102 – Simultaneously measured trajectory in L11, L12 and L2 localities. Trajectory in L5 locality was measured in different time.
Separate verification measurements were made in L11 and L12 locality by one measuring device in both localities. Measured displacements were very similar to displayed ones.
Those results repetitively support conclusion from L2 and L7 plus L1 and L10 measurement results. It is: Measured displacements are strongly dependent on measurement device altitude above terrain.
Another interesting conclusion from the experiment results can be surmised: The wall between L11 and L12 locality has great influence on measured displacements. Unknown interaction between the wall, the Sun and the weights exists. The measured displacements are strongly dependent on configuration of the very near surrounding of the experiment locality. Measured displacements can significantly different in localities positioned closer than 1m. Maybe relative space configuration and orientation of the weight, the wall and Sun cause the difference in measured displacements.
More experiments in better thermal conditions are needed to prove or disprove the hypothesis.
Time dependency
This section describes analysis results of measured displacements time dependency in different time scales.
Long-range time stability
The first analysis deals with long-range time stability and reproducibility of measured displacements trajectory in one locality.
Measured displacements results from L2 locality in specially selected days were used for the analysis.
The day selection criteria are:
- The day is close to astronomical important moment (equinox or solstice)
- Minimal weather change influence was in the day (sunny day without clouds)
Comparison results are in following figure.
Figure 103 – Measured long-term trajectory dependency in L2 locality. Separate trajectories from different days are shifted by individual offsets. The offsets were selected only for the figure readability and have no physical meaning and no relation with irregular component.
The results show trajectory long-term dependency.
The trajectory changes its amplitude, orientation in the plane and shape during one year. The trajectories change has one year period. Three years results are very similar.
Similar analyses were made with L8 locality measured displacements results. Measurements in L8 locality were short-time but repeated in different seasons. The days were selected to minimize weather influence. Astronomical important moment selection was not made. Measurements were not running in these moments.
Figure 104 – Measured long term trajectory dependency in L8 locality. The trajectory offsets were selected only for the figure readability and have no physical meaning and no relation with irregular component.
Similar measurement and result analysis was made in L11 locality. Two separate measuring experiments were made in the L11 locality in several months interval.
Figure 105 – Measured long term trajectory dependency in L11 locality.
L8 and L11 localities results partially verify L2 ones. No conflict was found. Annual periodicity can not be analyzed with respect of experiment duration.
Short-term time dependency
Short-term time dependencies are studied in following text.
Time relation of L2-NS and L2-EW measured displacements component with external temperature T-ext and Sun radiation RA-uexp in selected days were analyzed.
The days were selected with respect of weather and season. The selection procedure was:
- Measurement results from calendar month including astronomical important moment (equinox or solstice) were processed by 3minute averages.
- All other time intervals were not included in this analysis. Only every third month were used for the analysis (only 1/3 of total time series was used).
- Days with rapid and strong weather change were selected from that 3min results.
Measured displacements from those days with simultaneously measured external effects time dependency are displayed in following figures.
RA-max shows maximal theoretical Sun radiation in the locality without local shielding effect.
RA-uexp is measured Sun radiation very close to the L2 locality. See “Near locality measurements” for more detail locality description and appendix C for more detail RA-uexp description.
The same scale is used for RA-max and RA-uexp. The scale is 2W/m2 per unit. The scale was selected to arrange measured displacements and radiation scales in more transparent figures. The scales relation is the same in all figures to enable comparison.
Figure 106 – Short time dependency between measured displacements, external temperature and Sun radiation in L2 locality – day 23.9.2001, 28.9.2001 and 29.9.2001.
Figure 107 – Short time dependency between measured displacements, external temperature and Sun radiation in L2 locality – day 22.12.2001, 23.12.2001 and 24.12.2001.
Figure 108 – Short time dependency between measured displacements, external temperature and Sun radiation in L2 locality – day 12.3.2002, 31.3.2002 and 26.6.2002.

Figure 109 – Short time dependency between measured displacements, external temperature and Sun radiation in L2 locality – day 27.6.2002 and 7.9.2002.
Figure 110 – Short time dependency between measured displacements, external temperature and Sun radiation in L2 locality – day 28.9.2002, 29.9.2002 and 30.9.2002. External effect measurement device failure was 28.9.2002 from 13:00 to 14:30 UTC.
Figure 111 – Short time dependency between measured displacements, external temperature and Sun radiation in L2 locality – day 12.3.2003, 25.3.2003 and 26.3.2003.
The figures show repeatable time relations between Sun radiation change events and L2-EW or L2-NS measured displacements events. The Sun radiation events are synchronous with measured displacements one. Different behaviour of external temperature can be found in some day results. Some synchronous external temperature events and Sun radiation events and measured displacements events can be found in some days. Other external temperature events are not synchronous with Sun radiation events or measured displacements events. Some measured displacements events are not synchronous with no Sun radiation events or with no external temperature events.
Reproducibility of short-term time dependency
More systematic selection of the analysed time interval is used in following analysis.
The selection criteria were:
- 1 year period of continuously measurement in basic locality
- 4 day continuous time interval was selected from every month
- The selected time interval should contain days with great Sun radiation, small Sun radiation and rapidly changed Sun radiation if possible.
- Simultaneously measured results from other near localities are displayed if exist
Time interval November 2003 – October 2004 was selected from L2 locality to enable comparison with simultaneously measured results from near localities (L9, L13, L14 and L15). See “Near locality measurements” for detail near locality description.
Following 12 figures show selected 4 day time intervals from every month.
RA-max shows maximal theoretical Sun radiation in the locality without local shielding effect. The same scale is used for RA-max and RA-uexp. The scale is 2W/m2 per unit. The scale was selected to arrange measured displacements and radiation scales in more transparent figures. The scales relation is the same in all figures to enable comparison. It is used the same scales relation as in previous text.
Figure 112 – Short time dependency between measured displacements, external temperature and Sun radiation in L2 locality – November 2003. RA-uexp peak 11:30 5.11.2004 was probably caused by the Sun radiation sensor error or the sensor measured results temperature correction error.
Figure 113 – Short time dependency between measured displacements, external temperature and Sun radiation in L2 and L13 localities – December 2003.
Figure 114 – Short time dependency between measured displacements, external temperature and Sun radiation in L2, L13 and L14 localities – January 2004. L2 measurement failure was 6.1.2004 from 10:30 to 24:00 UTC.
Figure 115 – Short time dependency between measured displacements, external temperature and Sun radiation in L2, L13 and L15 localities – February 2004.
Figure 116 – Short time dependency between measured displacements, external temperature and Sun radiation in L2 and L14 localities – March 2004.
Figure 117 – Short time dependency between measured displacements, external temperature and Sun radiation in L2 and L14 localities – April 2004.

Figure 118 – Short time dependency between measured displacements, external temperature and Sun radiation in L2 locality – May 2004.
Figure 119 – Short time dependency between measured displacements, external temperature and Sun radiation in L2 locality – June 2004.
Figure 120 – Short time dependency between measured displacements, external temperature and Sun radiation in L2, L13 and L15 localities – July 2004.
Figure 121 – Short time dependency between measured displacements, external temperature and Sun radiation in L2, L9 and L14 localities – August 2004.
Figure 122 – Short time dependency between measured displacements, external temperature and Sun radiation in L2 and L14 localities – September 2004.
The results show:
- Measured displacements change theirs gradient in very close time position to significant Sun radiation change.
- The results do not enable more precise determination of the value and sign of the time difference between gradient change event and Sun radiation change event. The time difference is lower than about +/- 15 min.
- There exist events in measured displacements with no equivalent Sun radiation event. Every significant Sun radiation event have time synchronous measured displacements event.
- Every measured displacement 24 hour amplitude is correlated with Sun radiation integral in the same day. Great measured displacements amplitude is in the same day with great Sun radiation integral, small measured displacements amplitude is in the same day with small Sun radiation integral. Partial Sun radiation has synchronous measured displacement pair in the same day. No exception was found.
- The size of measured displacements events is not constant to the size of Sun radiation event (Sun radiation integral). The size relation is changing in time. The relation value change do not destruct previously formulated global features, but disable time constant linear dependency between Sun radiation integral and measured displacements.
- The time difference between external temperature events and measured displacements events (local maximums/minimums time positions, maximum gradient time positions) changes from zero to several hours. Very different time difference can be found in one day.
The conclusion can be formulated:
- The results show reproducibility of timing between Sun radiation events and measured displacement events.
- No reliable timing between external temperature and measured displacements was found.
- Other recognised features destruct idea of direct causality between Sun radiation and measured displacements.
Near locality measurements
Experiment goal is to verify measuring reproducibility in similar conditions and temperature dependency of measuring device including comparison measurements.
All experiments were made in one room. Two or three simultaneously operating measuring devices were used. Two “external” measuring devices was measuring measured displacements standard way (L2 and L14 or L15 localities) and “central” measuring device (locality L9 or L13) was used different way in different experiment.
Experiments configuration can be seen from following figures.
Figure 124 - Experiment surrounding schema. Building shape, dimensions and orientation.
Figure 125 - Experiment configuration
schema. L2, L9 and L14 localities are in the same altitude. L13 and L15
localities are 1m higher. S- Sun radiation and external temperature sensor. E –
Exposition by Sun radiation and external temperature. W – Window.
The walls are made of ferro-concrete panels. Wider panels form building’s
external cover; weaker panels form building’s internal supporting structure.
The room with measurement devices is totally closed. It has no window. Single
full door connects the room with internal corridor.
Configurations of separate experiments and measured results are described in separate chapters in following text.
Two weights in the same altitude
L9 locality was used for comparison measurement with L2 locality. Both weight hanging wires were fixed to the same ceiling by two hangers. Microcamera holders are fixed into different walls. The microcamera holders form 135° angle. Medium time period comparison is goal of the experiment.
Standard separate calibrations were used for both measurement sets.L2 and L9 localities measurement results were transformed only by offsets in following figure.
Figure 126 – Time dependence comparison of measured displacements in L2 and L9 localities – December 2002 – February 2003.
The comparison measurement results show acceptable correspondence between two simultaneously measured displacements.
Simultaneously measured trajectories are on the following figure.
Figure 127 – Simultaneously measured trajectory in L2 and L9 localities.
Simultaneously measured trajectories are similar each other but they are not identical. The trajectory comparison shows that measurement results differences between L2 a L9 trajectories can not be caused only by calibration errors. Other effect causing the differences between L2 and L9 localities measured results must exist.
Two measuring devices were different orientation. The angle difference was 135°. The measured displacements transformed into geographic coordinates are similar. The different measuring devices orientation is not present in measured displacements in geographic coordinate system. Primary raw measured data were very different in measuring device relative coordinate systems.
All weights in the same altitude
Three standard measuring devices placed in three near localities (about 1m distance between localities) were used in the experiment. The weights hanged in the same altitude on the same length hanging wire were used in all three localities.
Measurements were made in L2, L9 and L14 localities. Measuring devices used different image sampling period (L2 -15s, L9 - 60s a L14 - 40s).
Real view of the central measuring locality is on the following figure.
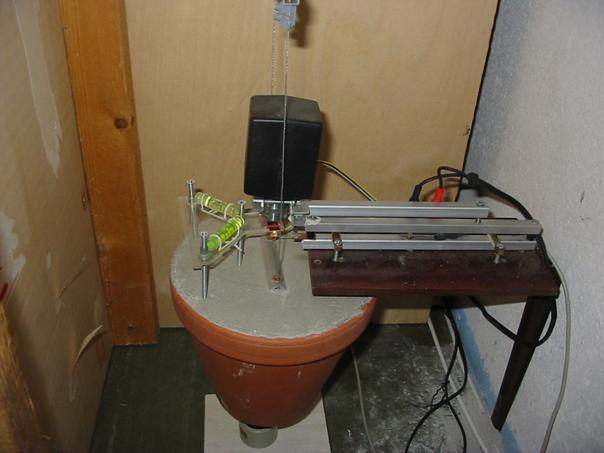
Figure 128 – Standard measuring device in basic altitude real view.
Measured results are in following figures.
Figure 129 – Time dependence of simultaneously measured displacements in L2, L9 and L14 in EW direction.
Figure 130 – Time dependence of simultaneously measured displacements in L2, L9 and L14 in NS direction.
Figure 131 – Time dependence of simultaneously measured displacements 30min. variance in L2, L9 and L14 localities.
The results show, that measured displacements are very similar in all localities but not equal.
Measured displacements in EW direction are similar and synchronous. They have considerable 24hour period and equal waveform characteristic in different days. Displacements are different in different days.
Measured displacements in NS direction have similar long term waveform. 24hour periodical component exists in all localities but timing and shape are very different. L9-NS and L14-NS are more similar each other than in comparison with L2-NS.
Measured displacements variances are very similar but not the same. Average variance value L2 is about twice greater than L14 one.
Selected parts of measured results together with measured internal temperature measured in different places are in following figure. The figure can be used for time relations analysis.
T-int was measured close to L2 weight (about 30 cm horizontal distances), TA was measured very close to the microcamera holder in L9 locality (about 1 cm distance), TB was measured very close to the microcamera holder in L14 locality (about 1 cm distance), TC was measured close to the weight holder, close to the ceiling in L9/L13 position (about 5 cm distance), and TD was measured close to the weight holder, close to the ceiling in L14/L15 position (about 5 cm distance).
Figure 132 – Time dependence of simultaneously measured displacements in EW direction and internal temperature in L2, L9 and L14 localities.
The results show minimums and maximums time shifts between internal temperature and measured displacements about 6 hours. It can be seen particularly 18.8. and 19.8.
Waveform from 20.8. is very interesting. No quick changes in temperature can be seen but measured displacements of all three measuring devices results show quick synchronous change near 16:00. Two measuring device results show additional quick changes close 21:00.
Similar effect can be seen 21.8 in all three measuring devices results.
Following figure shows measured displacements in the same selected time interval as in previous figure with simultaneously measured external quantities.
Figure 133 – Time dependence of simultaneously measured displacements in L2, L9 and L14 localities in EW direction, external temperature T-ext and Sun radiation RA-uexp.
Measured displacements comparison with external temperature and Sun radiation is different from comparison with internal temperature. Maximums and minimums of measured displacement and external temperature are more close each other than in case of internal temperature. External temperature minimums precede measured displacement minimums (from about 1hour precedence of T-ext before L14-EW day 18.8. to about 9hour precedence T-ext before L2-EW day 21.8.). External temperature maximums precede measured displacement maximums about 1 to 3 hours.
External temperature T-ext has local maximum in about 8:30 day 21.8. No measured displacement has some similar maximum. In opposite case, Two from three measured displacements shows local maximum in about 21:00 day 20.8. External temperature has not that maximum but continuous decreasing with constant gradient.
Sun radiation and measured displacements comparison shows very good time coincidence and integration nature of measured displacements with respect of Sun radiation.
It is not valid for all measured displacement minimums. Measured displacements shows very good time coincidence of minimums in L2 locality. Measured displacements minimums in L14 locality are not as sharp as in L2 locality and precede start of intensive Sun radiation about 2 hours in days with intensive Sun shine. Measured displacements minimums in L9 locality are more sharp than L14 one but are more wide than L2 one.
Note. The Sun radiation was measured on the opposite site of the wall, where L2 measuring device microcamera is mounted. External temperature was measured in the same place.
L9 and L14 measuring device microcameras are mounted to another wall. It is an internal wall. The internal wall is not exposed by the Sun from any site. The wall has no external temperature on any site. The ceiling or the ground has no external temperature on any site. The external temperature and Sun radiation exposition is only on the opposite site of two parts of the wall (the wall with L2 microcamera and wall neighbour to the wall with L9 and L14 microcamera). L14 locality has about twice greater distance from L2 locality than L9 one.
Following figures show simultaneously measured displacements trajectory in all three localities from one cloudless day. The trajectories are shifted by individual offsets to enable well arranged display. Two time intervals are highlighted on every trajectory. Time interval 5-8hour is interval between Sun rise and intensive Sun radiation start close to L2 locality (end of Southeast building wing shielding). Time interval 16-17:30hour is interval between intensive Sun radiation end close to L2 locality (start of West building wing shielding) and Sun sunset.
Figure 134 – Simultaneously measured trajectory in L2, L9 and L4 localities.
The results show similar trajectories but not equal trajectories. All trajectories have dominant dimension in East-West direction independently on measuring device orientation. Two measuring devices fastened to the same wall in distance about 1m give partially different results. The result difference can not be explained only by direction or amplitude calibration error. L9 trajectory and L14 trajectory can not be made identical only by linear transformation.
Other interesting facts can be read from the results.
The distances between trajectory end points are very similar each other in all three trajectories (similar value and direction). They are not the equal each other.
All highlighted time intervals on all trajectories are very close to the significant change in the trajectory shape. In all cases one end of the interval is very close to the significant trajectory shape change. It is the end displaying the time of end or start of building shielding effect. The time of Sun rise or Sun sunset is close to small or none trajectory shape change.
More detail figure of all trajectories follows. The figure shows magnified part of previous figure.
Figure 135 – simultaneously measured detailed trajectory in L2, L9 and L4 localities.
The figure displays measured values in 30 min intervals. The distance between two measured points shows measured displacements gradient value. New time interval was added to the figure. It is the interval of greatest shielding effects of Southeast wing of the building. It is 7-8hour time interval. About 1-2 m total equivalent wide concrete wall is between the measuring device weight and Sun in the 7-8hour time interval. About 10 concrete walls and floors with internal empty or thermal insulation filled areas are between Sun and the weight. Only about 30 cm wide concrete wall is between the measuring device weight and Sun after the 7-8hour time interval.
The results show, that in all cases the very small measured trajectory gradient value is in the new 7-8hour time interval. Very great gradient values are closer than 1 hour after end of shielding effect. Great gradient value close to the shielding end (after shielding end) is more than about 5 times greater than low gradient value in time of maximal shielding (7-8 hour interval).
Working hypothesis was formulated: The gradient value difference in very close times is caused by the concrete shielding effect.
We will receive result based on the hypothesis: About 1-2 m wide concrete wall decreases measured displacements interaction about 5 times. The concrete shielding effect value can be described by penetration depth about 30-80cm (measured displacements interaction is ½ of original value in depth 30-80cm of concrete layer).
The weights in different altitudes
Three standard measuring devices placed in three near localities (about 1m distance between localities) were used in the experiment. Two weights were hanged in the same altitude on the same length hanging wire were used and one weight was hanged 1m lower than the others. Two hanging wires were shorter than the third one. The longer hanging wire was about two times longer than shorter ones.
Measurements were made in L2, L13 and L15 localities. L13 and L15 localities are about 1m higher than L2 one. L13 and L15 hanging wires are fixed in the same weight holders as in L9 and L14 localities. Measuring devices used different image sampling period (L2 -15s, L13 - 60s a L15 - 40s).
Measured results are in following figures.
Figure 136 – Time dependence of simultaneously measured displacements in L2, L13 and L15 in EW direction.
Figure 137 – Time dependence of simultaneously measured displacements in L2, L13 and L15 in NS direction.
Figure 138 – Time dependence of simultaneously measured displacements 30min. variance in L2, L13 and L15 localities.
The results show, that measured displacements are very similar in all localities but not equal. Correspondence is lower than in previous experiment.
Measured displacements in EW direction are similar and synchronous. They have considerable 24hour period and equal waveform characteristic in different days. Displacements are different in different days. L13 and L15 waveforms are very similar each other and differs from L2 in some days (i.e. 26.7 and 27.7.). 24 hour period amplitude in L15 locality is significantly greater than L2 or L13 ones (about +30%).
Measured displacements in NS direction have similar waveform only in L13 and L15 localities. It is valid for long term and for 24hour periodical component.
Measured displacements in L2 locality are different.
Measured displacements variances are different. There exists time period where the lowest variances is in L15 locality (12.7. – 17.7. and 27.7 – 1.8.). There exists time period where the greatest variances is in L15 locality (19.7. – 25.7.). There exists time period where lowest variances is in L2 locality (19.7. – 25.7.). Measured displacements variances in L2 locality is greater than in other localities ones in other time periods. Very great variances are continuously in L13-NS. It is about 2 times greater than L13-EW. Measured displacements variance in both directions are similar each other in other localities.
Selected parts of measured results together with measured internal temperature measured in different places are in following figure. The figure can be used for time relations analysis.
T-int was measured close to L2 weight (about 30 cm horizontal distances), TA was measured very close to the microcamera holder in L13 locality (about 1 cm distance), TB was measured very close to the microcamera holder in L15 locality (about 1 cm distance), TC was measured close to the weight holder, close to the ceiling in L9/L13 position (about 5 cm distance), and TD was measured close to the weight holder, close to the ceiling in L14/L15 position (about 5 cm distance).
Figure 139 – Time dependence of simultaneously measured displacements in EW direction and internal temperature in L2, L13 and L15 localities.
The results show minimums and maximums time shifts between internal temperature and measured displacements about 6 hours. It can be seen particularly 20.7. and 23.7.
Waveforms from 22.7. are interesting. No quick change of internal temperature was measured by any sensor but all three measured displacements shows very similar gradient change in the same time (near 10:00 and near 11:30). Similar effect can not be seen in other days.
Following figure shows measured displacements in the same selected time interval as in previous figure with simultaneously measured external quantities.
Figure 140 – Time dependence of simultaneously measured displacements in L2, L13 and L15 localities in EW direction, external temperature T-ext and Sun radiation RA-uexp.
Measured displacements comparison with external temperature and Sun radiation is different from comparison with internal temperature. Maximums and minimums of measured displacement and external temperature are more close each other than in case of internal temperature. External temperature minimums precede measured displacement minimums (precedence of T-ext before L15-EW or L13-EW are about 1-3 hours, precedence o T-ext before L2-EW are about 3 hour greater). External temperature maximums precede measured displacement maximums about 2 hours.
All measured displacements maximums are about in the same time. Measured displacements minimums are not synchronous in all waveforms. L15-EW precedes L2-EW about 3 hours.
L15 and L2 minimums are sharp and well visible. L13 minimums are flat and they are between L15 and L2 ones.
Sharp external temperature decreasing can be seen in about 10:00 day 22.7. The decreasing is synchronous with measured displacements decreasing in all three waveforms. Following external temperature increasing precedes measured displacements increasing about ½ hour.
Small and short decreasing in about 14:00 are fully synchronous. The same can be seen between 13:00 and 15:00 day 21.7.
External temperature and all measured displacements are increasing after decreasing 10:00 day 22.7. External temperature is decreasing or constant, but all measured displacements are increasing after decreasing 13:00 to 15:00 day 21.7. and 14:00 day 22.7.
Sun radiation and measured displacements comparison shows very good time coincidence and integration nature of measured displacements with respect of Sun radiation.
It is not valid for all measured displacement minimums. Measured displacements shows very good time coincidence of minimums in L2 locality.
Following figures show simultaneously measured displacements trajectory in all three localities from one cloudless day. The trajectories are shifted by individual offsets to enable well arranged display. Two time intervals are highlighted on every trajectory. Time interval 4-8:30hour is interval between Sun rise and intensive Sun radiation start close to L2 locality (end of Southeast building wing shielding). Time interval 15:30-18:30hour is interval between intensive Sun radiation end close to L2 locality (start of West building wing shielding) and Sun sunset.
Figure 141 – Simultaneously measured trajectory in L2, L13 and L15 localities.
The results show similar trajectories but not equal trajectories. All trajectories have dominant dimension in East-West direction independently on measuring device orientation. Two measuring devices fastened to the same wall in distance about 1m give partially different results. The result difference can not be explained only by direction or amplitude calibration error. L9 trajectory and L14 trajectory can not be made identical only by linear transformation.
Other interesting facts can be read from the results.
The distances between trajectory end points are similar each other in all three trajectories (similar value and direction). They are not the equal each other.
All highlighted time intervals on all trajectories are very close to the significant change in the trajectory shape. In all cases one end of the interval is very close to the significant trajectory shape change. It is the end displaying the time of end or start of building shielding effect. The time of Sun rise or Sun sunset is close to small or none trajectory shape change.
The results are very similar as results from chapter “All weights in the same altitude”. The time intervals have different time limits but the same physical meaning. The time limits shift respects different geometry of Earth-Sun system in the experiment time.
More detail figure of all trajectories follows. The figure shows magnified part of previous figure.
Figure 142 – Simultaneously measured detailed trajectory in L2, L13 and L15 localities.
The figure displays measured values in 30 min intervals. The two measured points distance shows measured displacements gradient value. New time interval was added to the figure. It is the interval of greatest shielding effects of Southeast wing of the building. It is 7:30-8:30hour time interval.
The results show, that in all cases the very small measured trajectory gradient value is in the new 7:30-8:30hour time interval. Very great gradient values are closer than 1 hour after end of shielding effect.
Some differences can be identified relatively to previous experiment. Great gradient value close to the shielding end (after shielding end) is more than about 5 times greater than low gradient value in time of maximal shielding (7:30-8:30 hour interval). It is valid only for L2 locality. The ratio is lower in L13 and L15 localities. It is about 3.
The smaller gradient values are directly before the interval in L13 and L15 localities.
The differences are not fundamental. The basic behaviour is similar to the previous experiment.
The difference can be explained by different surroundings configuration. More detail knowledge of measured physical quantity feature is needed for confirming or excluding the explanation.
The weights and solid base
Two standard measuring devices and one modified measuring device were used in the experiment. Two standard devices were placed in two near localities (about 2 m distance) and modified measuring device was placed in the centre. Two weights were hanged in the same altitude and the same length hanging wires were used. The weight was not used in central locality. The microcamera together with the microcamera holders and the microraster were placed on the same solid base. The solid base was made from one concrete piece.
The experiment is designed to measure temperature dependency of the measuring device in comparable condition with standard measurement.
Measurements were made in L2, L9 and L14 localities. The solid base was placed in area where the weight of L9 had been placed. The experiment differs from the “All weights in the same altitude” experiment only by the solid base placed instead of the weight in L9 locality.
Measuring devices used different image sampling period (L2 -15s, L9 - 60s a L14 - 40s).
Real view of the central measuring locality is on the following figure.
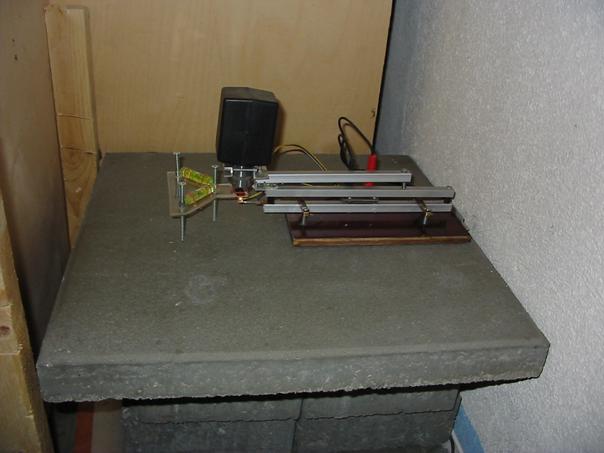
Figure 143 – Measuring device with solid base real view.
Measured results are in following figures. The same raw results transformation as in case of standard measurement in L9 locality was used to enable result comparing.
Figure 144 – Time dependence of simultaneously measured displacements in L2, L14 and L9 with solid base in EW direction.
Figure 145 – Time dependence of simultaneously measured displacements in L2, L14 and L9 with solid base in NS direction.
Figure 146 – Time dependence of simultaneously measured displacements 30min. variance in L2, L14 and L9 with solid base.
The results show, that measured displacements are very similar in external localities (L2 and L14) but not equal. Measured results in L9 locality are totally different.
Measured displacements in EW direction in L2 and L14 are similar and synchronous. They have considerable 24hour period and equal waveform characteristic in different days. Displacements are different in different days.
Measured displacements in NS direction in L2 and L14 have similar long term waveform. 24hour periodical component exists in both localities but timing and shape are very different.
Measured displacements in L9 locality has totally different waveform in both directions form other two measuring devices.
Measured displacements variances show similar results. Variances in L2 and L14 are very similar but not the same. Variances in L9 locality are many times lower and time independent. L9 variances are more than 20 times lower than average variance in other localities.
Computed displacements were compared with measured displacements from L9 locality. Computed displacements were computed from measured internal temperature measured in place of the microcamera holder (TA). The temperature coefficient of the measuring device together with solid base was determined from the approximation of measured results by computed displacements.
Theoretical value of thermal expansion coefficient was estimated in appendix A. The value of the coefficient in the microcamera holder axis direction was estimated about 8.3µm/°C. The measured value is decreased by the solid base thermal expansion. The solid base thermal coefficient should be estimated about 0.15 – 0.3µm/°C (about 25cm distance of concrete).
Measured displacements together with measured internal temperature TA and computed (simulated) displacements are in the following figure.
Figure 147 – Measured results on solid base in L9 locality, internal temperature TA and simulated thermal expansion in microcamera holder axis direction (sim.displ. EW). Microcamera holder was oriented in EW direction. Simulated thermal expansion computing used global measuring device thermal expansivity coefficient value 5.5µm/°C.
Measured displacements on solid base are very similar to the simulated thermal expansivity. Approximated value of global measuring device thermal expansivity is in good agreement with theoretical thermal expansivity coefficient. The difference in value can be easily explained by the range of thermal expansivity coefficient table values of different materials used in measuring device (i.e. plexiglas thermal expansibility coefficient table values are in range 44-83 *10-6 °C-1, concrete expansibility coefficient table values are in range 6-12 *10-6 °C-1).
Maximal measured displacement difference L9-EW in 24 hour is lower than equivalent difference 20µm/s2. Maximal measured 24 hour periodical displacement amplitude L9-EW is lower than equivalent amplitude 5µm/s2. Simultaneously measured displacements in L2 and L14 localities have 24 hour amplitude about 220µm/s2. The 24 hour amplitude in L9 locality is less than 2.5% of simultaneously measured amplitudes in L2 and L14 localities.
Selected parts of measured results together with measured internal temperature measured in different places are in following figure. The figure can be used for time relations analysis.
T-int was measured close to L2 weight (about 30 cm horizontal distances), TA was measured very close to the microcamera holder in L9 locality on solid base (about 1 cm distance), TB was measured very close to the microcamera holder in L14 locality (about 1 cm distance), TC was measured close to the weight holder, close to the ceiling in L9/L13 position (about 5 cm distance), and TD was measured close to the weight holder, close to the ceiling in L14/L15 position (about 5 cm distance).
Figure 148 – Time dependence of simultaneously measured displacements in EW direction and internal temperature in L2, L14 and L9 with solid base.
Result comparison in L2 and L14 localities gives similar conclusions as in case of “All weights in the same altitude” experiment. It confirms reproducibility.
Result comparison in L9 locality with internal temperature confirms coincidence of the results with internal temperature. All internal temperatures have similar waveforms.
Following figure shows measured displacements in the same selected time interval as in previous figure with simultaneously measured external quantities.
Figure 149 – Time dependence of simultaneously measured displacements in L2, L14 and L9 with solid base in EW direction, external temperature T-ext and Sun radiation RA-uexp.
Result comparison in L2 and L14 localities gives similar conclusions as in case of “All weights in the same altitude” experiment too. It means Sun radiation and measured displacements comparison have very good time coincidence and integration nature of measured displacements with respect of Sun radiation. It confirms reproducibility.
On contrary, result comparison from L9 locality shows no time coincidence with external quantities.
It can be resumed:
- Measured displacements in L9 locality with solid base are dependent on internal temperature. It can be explained by thermal expansivity effect of the measuring device. The measured value of thermal expansion coefficient is in good correspondence with theoretically derived value.
- Simultaneously measured displacements with the weights in near localities L2 and L14 give quite different results with many times greater displacements and no time coincidence with internal temperature.
- Measured results error caused by thermal expansivity of measuring device is in case of great measured displacements with 24 hour period lower than 2.5%.
Experiment conclusions
Experiments results show:
- Measured displacements simultaneously gauged with the weights are reproducible – displacements from two or three simultaneously running measuring devices in near localities are very similar in all cases.
- Measured displacements are around independent on measuring device orientation if results are transformed into geographic coordinate system. Small difference can be recognized. Raw measured data are strongly dependent on measuring device orientation relative to geographic coordinate system.
- Measured displacements from one locality gauged in different time period need not be reproducible.
- Measured displacements gauged on solid base are totally different from the measured displacements gauged with the weight in very similar conditions (the same time period, similar temperature conditions and in very near localities).
- Measured displacements gauged on solid base agree with thermal expansivity of measuring device dependent on internal temperature. Thermal expansivity coefficient of measuring device approximated from measured results is 5.5μm/°C (theoretically estimated value is 8μm/°C).
- Measured displacements gauged on solid base are significantly lower than simultaneously measured displacement gauged with the weight in near localities. The measured displacement 24 hour amplitude on the solid base is lower than 3% of the weight measured ones in days with great 24 hour periodic displacements.
- The weight in different altitudes measured displacements are very similar in spite of the hanging wire length in higher locality is about one half the one in lower locality (absolute raw displacement in higher locality is about one half of lower locality one). Minimums time positions and waveform shapes are partially different in higher localities than in lower localities. Maximums time positions are synchronous.
- Measured displacements gauged in different near localities are reproducibly different in some details. The differences increase with growing distance between localities.
- Measured displacement variances are greater in higher localities than in lower ones. Primary measured values transformation to physical value differs in lower and in higher localities (different length of hanging wire).
- Measured displacement variances gauged on the solid base are very small and time constant (it is more than 10 times lower than the weight gauged ones)
- Measured displacements gradient value changes very rapidly in the time of start and end of shielding effect caused by the building. Gradient value changes more than 1:5. Working hypothesis can be formulated: The gradient value difference in very close times is caused by the building material shielding effect.
- Penetration depth of building material (concrete) can be estimated from the hypothesis, measured value and the building parameters. It is 30-80cm (measured displacements interaction is ½ of original value in depth 30-80cm of concrete layer).
- Simple shielding effect like light shielding effect can not be the only explanation of measured effects. More complicated shielding effect (like low frequency radiowave shielding) or other effects need to be considered to explain fully measured effects.
It can be concluded from experiment result:
- Measuring device with the weight gauges displacements caused by other physical effect, than only the temperature in the measuring device area.
The temperature in the measuring device area causes measurable displacements.
The temperature caused displacements are lower than estimated measuring device precision in case if the temperature difference is not very high. No special device or special measurement conditions are needed to create acceptable thermal condition. Standard room thermal insulation in closed room is sufficient for acceptable measurement precision.
The error caused by thermal dependence of measuring device was lower than 3% for high amplitude displacements with 24 hour period in L2 and near localities.
Measuring device placed in free outside temperature condition gives measured displacements with significant thermal expansion effect error.
- Measured displacements are independent on measuring device orientation if they are transformed into geographic coordinate system. The measured displacements must be caused by external physical quantity. No physical quantity relative to measuring device can cause measured displacements.
- Measured displacements in relatively near localities (difference in the weight positions are about 1m in horizontal and vertical positions) are similar and are reproducible by the simultaneous measurement with different measuring devices. The results are time irregular and can not be repeated reproducibly in time.
No reproducibility can be expected in case of repeated measurement by one measuring device.
- Near localities positions differences about 1m cause recognisable difference in measured displacements. The differences are in timing, waveforms and amplitudes. The differences are relatively low. The measured results do not contain that great difference significantly exceeding measuring device precision to enable formulate some reliable conclusion in that area.
Reproducibility and Space Dependency Conclusions
Primary conclusions of this part of the appendix are summarized in following points:
- Time dependent displacements were measured in all localities. 24 hour periodic displacements can be clearly identified in all localities placed on terrain level or above terrain level. Measurement results from localities placed under terrain level contain small and unreliable periodic component.
- Important similarities between measured displacements from minimally two localities were recognized from three localities simultaneously measured results if periodic component were in all localities. Very similar displacements were measured in all simultaneously measurements in near localities.
- Measured displacements results are continuous and smooth (excluding human or animal interactions or technical problems or great far earthquake waves).
- Two or three measurement sets working very close to each other give similar measured results transformed into geographic coordinate independently on measuring device orientation and independently on the wall orientation.
- Very strong dependency of measured displacements on altitude above terrain exists. It was identified in all localities where relevant measurements were made.
- Measured displacements long-term trajectory change exists. It repeats with annual period. The long term dependency was recognized in all localities where relevant measurements were made. Annual dependency was repeatedly verified in more than 4 years measurement in L2 locality and about 3 years measurement in L1 locality.
- The temperature caused displacements are lower than estimated measuring device precision in case if the temperature difference is not very high. The error caused by thermal dependence of measuring device was lower than 3% in the experiment (for high amplitude displacements with 24 hour period). It was verified for L2, L9, L13, L14 and L15 localities.
- L2-NS, L2-EW, L9-NS, L9-EW, L13-NS, L13-EW, L14-NS, L14-EW, L15-NS and L15-EW repeatable changed its response in the same time as Sun radiation change in days with rapid weather change. No Sun significant Sun radiation change without synchronous measured displacement change was observed. Additional measured displacements changes were observed without synchronous Sun radiation change. No simultaneously running Sun radiation measurements were made in other localities.
- L2-NS, L2-EW, L9-NS, L9-EW, L13-NS, L13-EW, L14-NS, L14-EW, L15-NS and L15-EW repeatable changed its response in the same time as building shielding caused Sun radiation change in sunny days. No exception was found in L2 locality. Other changes were recognised in other near localities close to the shielding change time. No simultaneously running Sun radiation measurements were made in other localities.
- Measured phases of 24hour periodic element have specific features. It can be described as 2 phase group in every direction element. All 4 combinations of phase groups can be found in measured displacements.
- All two possible measured trajectory orientations in horizontal plane were recognised. Trajectories with very flat trajectory or trajectory with crossing were measured too.
- Measured displacements in all localities include irregular time dependent displacements forming low frequency noise. The noise frequency spectrum can be described as pink noise (1/f). The measured irregular time dependent displacements in geographical coordinate system are independent on measuring device orientation.
Secondary conclusions can be derived from measured results and primary conclusions:
- Measurement is reproducible by simultaneously measuring devices in very near localities placed in the same altitude with respect of measurement errors corresponding with measurement precision i.e. about +- 10%.
- Measured displacements are caused by external vector physical quantity. Measured displacements can not be caused by any scalar physical quantity.
- Thermal dependency of measuring device produces measuring error. The error is lower than measuring device precision in closed room thermal conditions.
- The results are time irregular and can not be repeated reproducibly in time.
No reproducibility can be expected in case of repeated measurement by one measuring device.
- Measured displacements are strongly space dependent. The measured displacements can be different in very near localities. Only a few meters or decimetres difference in measuring device placement can cause different measured results (in very similar experiment conditions). It was repeatedly validated great altitude dependency. Altitude difference 1m can be recognized from simultaneously measured displacements. Altitude difference about 5m and greater caused very different timing and amplitudes of 24 hour periodic component in all experiments. It was repeatedly validated geographic coordinate strong dependency. Only a few hundreds meters and probably less can cause very different timing, amplitudes, phases or trajectory orientation change.
- Long term measurement displacements were repeatedly recognised in all localities where relevant measurements were made. Annual period were recognised in all two several years measurements. Spectral analysis and 24 hour amplitude time dependence analysis confirms annual period.
- Very great amplitude of low frequency noise is included in all measured displacements results. Pink noise character was recognised in all relevant measurement results. The noise is included in measured physical quantity. The same or very similar values were measured in simultaneous measurements in near localities in similar conditions.
- Measured displacements long-term time dependency with annual period, great amplitude of pink noise component in measured displacements and very strong dependency of measured displacements on altitude and probably dependence on near surrounding geometry and materials disable creating definite conclusions about space dependency. No reliable deduction about geographical coordinate dependency could be made. More experiments are needed.
- Recognised time synchronous events can be explained by shielding effect of building or clouds. The hypothesis enables estimation of penetration depth of building material (concrete). It is 30-80cm (measured displacements interaction is ½ of original value in depth 30-80cm of concrete layer).